Using field and satellite data to map vegetation in the Réserve de Faune de Ouadi Rimé-Ouadi Achim
Read here the last article of Sandscript 32nd issue
Like many Sahelian landscapes, the Réserve de Faune de Ouadi Rimé-Ouadi Achim (RFOROA) in Chad is made up of relatively small patches of natural vegetation and human land uses, scattered across sandy soils that make for harsh growing conditions.
Small agricultural fields are mixed with grasslands, which are dotted with stands and crossed by wadis of short, scrubby trees. Plants native to the Sahel typically grow at low densities: patches of grass that seem lush from a distance look surprisingly sparse up close. And all vegetation in the RFOROA is ruled by the same limiting factor: water, whether drawn from underground reservoirs or absorbed from rainfall.
Since 2019, the Smithsonian’s National Zoo and Conservation Biology Institute (SNZCBI) and Sahara Conservation have been working together to create a map of the vegetation communities and land uses across the reserve. However, the very conditions that define the Sahel and the RFOROA – fine spatial heterogeneity, strong seasonality, low leaf density, and water limitation – make vegetation mapping particularly challenging.
Every time the Sahara Conservation ecological monitoring team observes an oryx or addax in the field, they collect important information about nearby vegetation – such as general habitat type, the greenness and height of seasonal grasses, and the presence and condition of plants important in oryx and addax diets. Though the team has collected more than 10,000 observations since 2016, these cover only a small portion of the reserve each year. To make a seamless map across the vast extent of the RFOROA requires combining field observations with remotely sensed data – information and images collected by satellites orbiting the earth.
We usually think of a color photograph as a simple, flat sheet. However, every photograph is actually a stack of three layers, each one a grid that contains thousands of tiny cells, or pixels. One-layer expresses the amount of red light reflected toward the camera from each pixel, while other layers capture the amount of reflected green and blue light. This is the origin of the term “RGB,” for “red, green, and blue.” Similarly, earth-observing satellites measure solar radiation reflected by the planet’s surface – not just in red, green, and blue wavelengths, but in many parts of the electromagnetic spectrum, from ultraviolet to infrared.
Vegetation, rocks, and sand reflect different wavelengths of light and energy in unique ways. For example, green plants reflect strongly in the near infrared portion of the spectrum – but only weakly in red wavelengths. Accordingly, a large difference in reflectance in near-infrared versus red wavelengths at a given location indicates green and growing vegetation. SNZCBI and Sahara Conservation used these and other characteristic properties to create many remote sensing products, each one highlighting the presence or abundance of a different kind of natural land cover or human land use found in the Sahel.
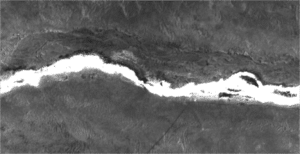
NDVI image
We also used satellite data to study when vegetation in the reserve grows and dies. Native grasses usually sprout immediately after the first rains of the year – while agricultural fields must be ploughed and seeded before any crops can grow. This gives grasses a “head start” to reach peak growth before common crops like sorghum, millet, and maize. Leaf density also tends to be higher in agricultural fields at peak growth, because farmed plants usually have larger leaves, and grow much taller and wider, than narrow-leaved and sparsely spaced Sahelian grasses. Finally, agricultural crops experience a compressed growth cycle that not only starts and peaks later than native grasses, but also ends sooner. While farmed plants are harvested at peak growth to feed humans or livestock, annual grasses naturally wilt and dry out.
We conducted many analyses of remotely sensed data to capture the unique properties of different land cover and land use types across the RFOROA. By combining these remote sensing layers with data from routine and dedicated field missions, SNZCBI and Sahara Conservation have created the first accurate, medium-resolution land cover map (i.e., with pixels measuring 20m x 20m) of the reserve. This information will be used to better understand the habitat preferences of reintroduced oryx and addax, and predict their potential distribution across the RFOROA as these populations continue to grow.
Katherine Mertes
PhD – CONSERVATION ECOLOGY CENTER SMITHSONIAN’S NATIONAL ZOO & CONSERVATION BIOLOGY INSTITUTE
Elizabeth Johnson
Remote Sensing/ Spatial Ecology Intern – CONSERVATION ECOLOGY CENTER SMITHSONIAN’S NATIONAL ZOO & CONSERVATION BIOLOGY INSTITUTE